Профилирование и оптимизация
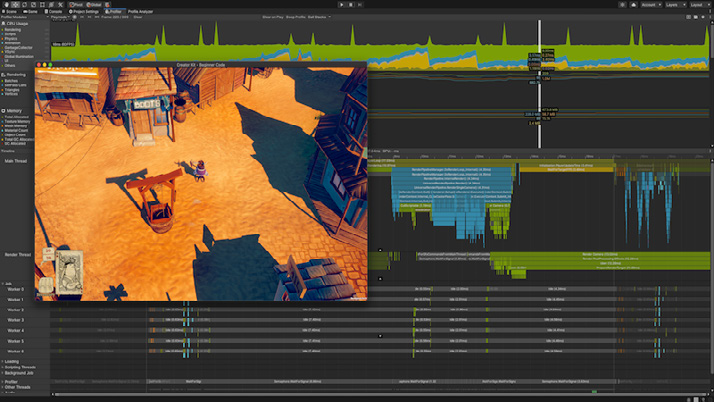
Profiling and optimization Once you’ve designed a great game, your next task is to make it fast. Unity includes a suite of profiling and optimization tools to help you maximize the available resources for your target platform. Unity Profiler The Unity Profiler gives you performance information about the application. For best results, run it on the end platform where you intend to publish your build. This gives you accurate timings about what impacts the performance of your application. The Profiler can also work directly from the Editor in Play mode. Just be aware that this setup sacrifices accuracy, so it’s useful as a quick check but not for a final assessment. The Profiler can help you identify areas for potential improvement in your application: the CPU, GPU, memory, renderer, physics, and audio. Iterate on those areas. You can pinpoint things like how your code, assets, scene settings, camera rendering, and build settings affect how well your application runs. The Profiler displays the results in a series of graphs so you can visualize where spikes happen.
The Unity Profiler
Unity provides a number of Profiler markers to give you insight into what is taking up time in your application. The ProfilerRecorder can also use these markers to get useful timings for your frame. Here are some of the most common markers: Profiler marker
Summary
Main thread base markers
Markers on the main thread containing samples from the main game loop, PlayerLoop, as well as the EditorLoop (present when you profile inside of the Editor)
Script update markers
Contain samples of MonoBehaviour.Update methods (Update/FixedUpdate/LateUpdate) and coroutines
Rendering and VSync markers
Contain the samples where the CPU spends time processing data for the GPU, or where it might be waiting for the GPU to finish
Back end scripting markers
Highlight Mono or IL2CPP scripting backend activities and can be useful for troubleshooting issues with garbage collection and allocation
Multithreading markers
Contain samples that do not measure the CPU cycles consumed, instead highlighting information that relates to thread synchronization and the Job System
Physics markers
Include high-level physics Profiler markers that sample Physics.Contacts, Physics. TriggerEnterExits, Physics.UpdateBodies, etc.
Performance warnings
Displayed when the Profiler detects some specific calls that you should avoid in performance-critical contexts
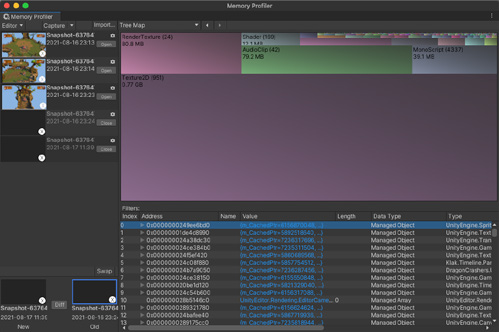
To access the Profiler window, navigate to the menu: Window > Analysis > Profiler. For a detailed overview of the window, see the Profiler window documentation. Memory Profiler The Memory Profiler is a tool you can use to identify areas in your Unity project and the Unity Editor where you can reduce memory usage. It gives you an overview of native and managed memory allocations, as well as the references between them that keep them in memory.
Use the Memory Profiler to capture, inspect, and compare memory snapshots to detect memory leaks and fragmentation.
The Memory Profiler main view in tree map view
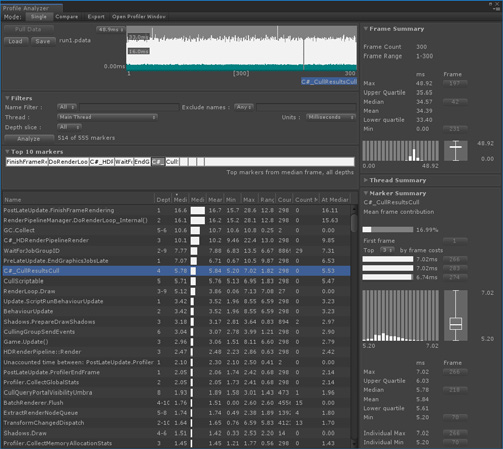
Profile Analyzer The Profile Analyzer aggregates and visualizes frame and marker data from a set of Unity Profiler frames to help you understand their behavior. You can use the Profile Analyzer to compare two sets of data side-by-side, complementing the single-frame analysis already available in the Unity Profiler. For information on how to use the Profile Analyzer, see the window’s documentation.
The Profile Analyzer
For a better understanding on optimization in Unity for mobile platforms, see this blog post, Optimize your mobile game performance. You can also download the full e-book outlining Unity experts’ optimization tips for mobile games.