Профилирование и оптимизация
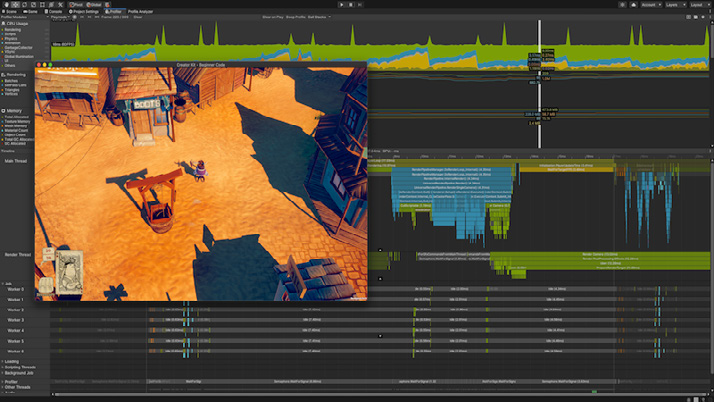
Профилирование и оптимизация После создания отличной игры следующая задача - обеспечить её высокую производительность. Unity включает набор инструментов профилирования и оптимизации, помогающих максимально эффективно использовать ресурсы целевой платформы. Unity Profiler Unity Profiler предоставляет сведения о производительности приложения. Для наиболее точных результатов запускайте его на целевой платформе, для которой планируете публиковать сборку. Так вы получите достоверные данные о времени выполнения операций, влияющих на производительность приложения. Profiler также можно запускать непосредственно из Unity Editor в режиме Play. Однако в таком режиме точность ниже: он подходит для быстрой проверки, но не для итоговой оценки. Profiler помогает выявить потенциальные направления оптимизации приложения: CPU, GPU, память, рендерер, физику и аудио. Последовательно оптимизируйте эти области. Так можно точно определить, как на работу приложения влияют код, ресурсы, настройки сцены, рендеринг камерой и настройки сборки. Profiler отображает результаты в виде графиков, на которых хорошо видны пики нагрузки.
Unity Profiler
Unity предоставляет множество маркеров Profiler, помогающих понять, на что приложение тратит время. ProfilerRecorder также может использовать эти маркеры для получения полезных временных показателей кадра. Ниже перечислены наиболее распространённые маркеры: Маркер Profiler
Краткое описание
Основные маркеры главного потока
Выборки основного игрового цикла PlayerLoop и EditorLoop при профилировании в Editor.
Маркеры обновления скриптов
Выборки MonoBehaviour.Update (Update, FixedUpdate, LateUpdate) и корутин.
Маркеры рендеринга и VSync
Участки обработки данных для GPU или ожидания завершения его работы.
Маркеры бэкенда скриптинга
Работа бэкендов Mono и IL2CPP; полезны при диагностике сборки мусора и выделения памяти.
Маркеры многопоточности
Сведения о синхронизации потоков и Job System без измерения циклов CPU.
Маркеры физики
Высокоуровневые маркеры Physics.Contacts, Physics.TriggerEnterExits, Physics.UpdateBodies и другие.
Предупреждения о производительности
Вызовы, которых следует избегать в критичных к производительности участках.
Чтобы открыть окно Profiler, выберите Window > Analysis > Profiler. Подробное описание окна приведено в документации Profiler. Memory Profiler Memory Profiler помогает находить области проекта Unity и Unity Editor, в которых можно сократить использование памяти. Он даёт обзор выделений нативной и управляемой памяти, а также ссылок между ними, из-за которых эти выделения остаются в памяти.
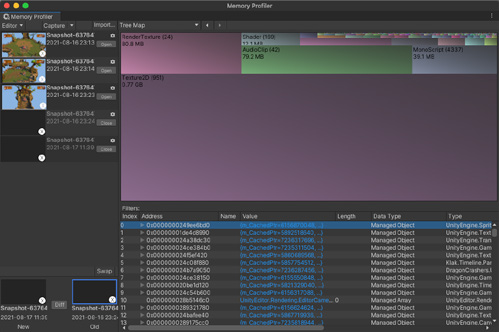
Используйте Memory Profiler, чтобы снимать, исследовать и сравнивать снимки памяти, выявляя утечки и фрагментацию.
Главное представление Memory Profiler в режиме Tree Map
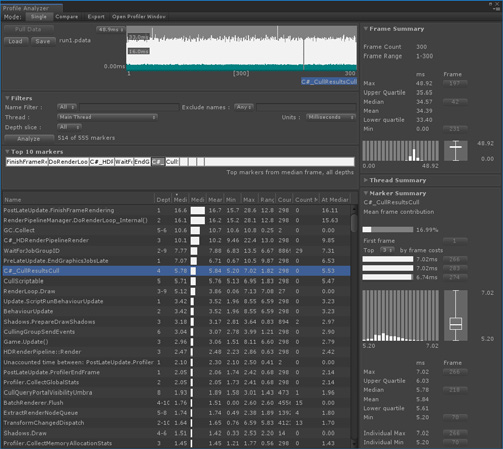
Profile Analyzer Profile Analyzer агрегирует и визуализирует данные кадров и маркеров из набора кадров Unity Profiler, помогая понять их поведение. В Profile Analyzer можно сопоставить два набора данных рядом друг с другом; это дополняет анализ одного кадра, доступный в Unity Profiler.
Инструкции по работе с Profile Analyzer см. в документации этого окна.
Profile Analyzer
Чтобы лучше разобраться в оптимизации Unity для мобильных платформ, прочитайте публикацию в блоге Optimize your mobile game performance. Также можно скачать полную электронную книгу с рекомендациями экспертов Unity по оптимизации мобильных игр.
Profiling and optimization Once you’ve designed a great game, your next task is to make it fast. Unity includes a suite of profiling and optimization tools to help you maximize the available resources for your target platform. Unity Profiler The Unity Profiler gives you performance information about the application. For best results, run it on the end platform where you intend to publish your build. This gives you accurate timings about what impacts the performance of your application. The Profiler can also work directly from the Editor in Play mode. Just be aware that this setup sacrifices accuracy, so it’s useful as a quick check but not for a final assessment. The Profiler can help you identify areas for potential improvement in your application: the CPU, GPU, memory, renderer, physics, and audio. Iterate on those areas. You can pinpoint things like how your code, assets, scene settings, camera rendering, and build settings affect how well your application runs. The Profiler displays the results in a series of graphs so you can visualize where spikes happen.
The Unity Profiler
Unity provides a number of Profiler markers to give you insight into what is taking up time in your application. The ProfilerRecorder can also use these markers to get useful timings for your frame. Here are some of the most common markers: Profiler marker
Summary
Main thread base markers
Markers on the main thread containing samples from the main game loop, PlayerLoop, as well as the EditorLoop (present when you profile inside of the Editor)
Script update markers
Contain samples of MonoBehaviour.Update methods (Update/FixedUpdate/LateUpdate) and coroutines
Rendering and VSync markers
Contain the samples where the CPU spends time processing data for the GPU, or where it might be waiting for the GPU to finish
Back end scripting markers
Highlight Mono or IL2CPP scripting backend activities and can be useful for troubleshooting issues with garbage collection and allocation
Multithreading markers
Contain samples that do not measure the CPU cycles consumed, instead highlighting information that relates to thread synchronization and the Job System
Physics markers
Include high-level physics Profiler markers that sample Physics.Contacts, Physics. TriggerEnterExits, Physics.UpdateBodies, etc.
Performance warnings
Displayed when the Profiler detects some specific calls that you should avoid in performance-critical contexts
To access the Profiler window, navigate to the menu: Window > Analysis > Profiler. For a detailed overview of the window, see the Profiler window documentation. Memory Profiler The Memory Profiler is a tool you can use to identify areas in your Unity project and the Unity Editor where you can reduce memory usage. It gives you an overview of native and managed memory allocations, as well as the references between them that keep them in memory.
Use the Memory Profiler to capture, inspect, and compare memory snapshots to detect memory leaks and fragmentation.
The Memory Profiler main view in tree map view
Profile Analyzer The Profile Analyzer aggregates and visualizes frame and marker data from a set of Unity Profiler frames to help you understand their behavior. You can use the Profile Analyzer to compare two sets of data side-by-side, complementing the single-frame analysis already available in the Unity Profiler. For information on how to use the Profile Analyzer, see the window’s documentation.
The Profile Analyzer
For a better understanding on optimization in Unity for mobile platforms, see this blog post, Optimize your mobile game performance. You can also download the full e-book outlining Unity experts’ optimization tips for mobile games.