IDE и отладка
IDE и отладка
Приостанавливайте выполнение с помощью Debug.Break Если приложение сложно приостановить вручную, а вам нужно проверить определённые значения в Inspector, вызовите Debug.Break, чтобы остановить выполнение в нужном месте кода.
Заменяйте проверку if вызовом Debug.Assert Debug.Assert проверяет условие во время выполнения и выводит сообщение об ошибке в Console, если условие возвращает false. В отличие от Debug.Log, который выполняется всегда, утверждения предназначены для выявления неожиданных состояний и помогают эффективнее проверять предположения, заложенные в коде.
// You can save the if statement in release... if (health > maxhealth) {

    Debug.LogError(“Current health is greater than maxhealth!”, this);
}
//... by

using an assertion Debug.Assert(health < maxhealth, “Current health is greater than maxhealth!”, this);
©2025UnityTechnologies
Используйте Debug.Log с контекстом При вызове Debug.Log вторым параметром можно передать объект - обычно GameObject или компонент. Тогда сообщение журнала связывается с этим объектом в Console: если щёлкнуть по сообщению, Unity выделит соответствующий объект в Hierarchy. Debug.Log(“Enemy spawned”, gameObject);
Выделяйте важные сообщения с помощью Rich Text Console в Unity поддерживает в сообщениях Debug.Log часть тегов Rich Text, например <b>, <i> и <color>. С их помощью можно выделять, окрашивать или подчёркивать отдельные фрагменты вывода журнала, чтобы важные сообщения были заметнее во время разработки. Debug.Log(“<b><color=red>Error:</color></b> Player health is critically low!”);Удаляйте вызовы Debug.Log из релизных билдов Unity не удаляет API журналирования Debug из билдов, не являющихся Development Build, автоматически. Оберните вызовы Debug.Log в собственные методы и пометьте их атрибутом [Conditional]. Если удалить соответствующий Scripting Define Symbol из Player Settings, все вызовы Debug.Log будут исключены при компиляции. Результат такой же, как при оборачивании вызовов в блоки препроцессора #if… #endif. Пример приведён в руководстве по общей оптимизации.
Диагностируйте физику, визуализируя raycast-запросы Возникли проблемы с физикой? Debug.DrawLine и Debug.DrawRay помогут визуализировать raycast-запросы, рисуя линию между заданными начальной и конечной точками.
// draw a 5-unit white line from the origin for 2.5 seconds Debug.DrawLine(Vector3.zero, new Vector3(5, 0, 0), Color. white, 2.5f);

}
©2025UnityTechnologies
Используйте Debug.isDebugBuild для Development Build С помощью Debug.isDebugBuild можно проверить, запущено ли приложение как Development Build. Это позволяет условно выполнять код, предназначенный только для отладки, - журналирование, диагностику или тестовые утилиты - не затрагивая релизные билды. if (Debug.isDebugBuild) { Debug.Log(“Running in Development Build mode.”); }
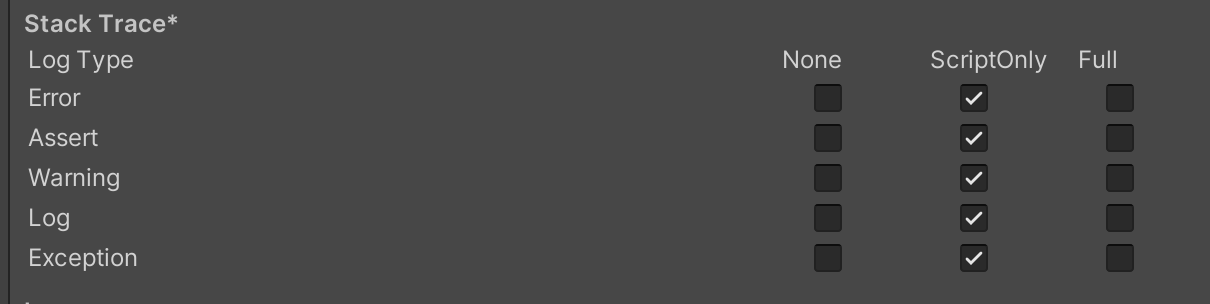
Настройте Application.SetStackTraceLogType Используйте Application.SetStackTraceLogType или соответствующие флажки в PlayerSettings, чтобы определить, для каких типов сообщений журнала следует добавлять трассировку стека. Трассировка стека полезна, но работает медленно и создаёт мусор.
Настройки Stack Trace в PlayerSettings окна Editor
Настройте журналирование под свои задачи API Logger позволяет создавать и настраивать собственные экземпляры Logger для более сложного или модульного журналирования. Можно пользоваться встроенным Debug.unityLogger, однако собственный логгер даёт более точный контроль над форматированием, фильтрацией и каналами вывода: var logger = new Logger(Debug.unityLogger.logHandler);
logger.Log(LogType.Log, “Custom log message”);
Ускорьте работу с помощью сочетаний клавиш Visual Studio Code Если вы выбрали Visual Studio Code в качестве IDE, вам могут пригодиться следующие сочетания клавиш:
Windows
Mac
©2025UnityTechnologies
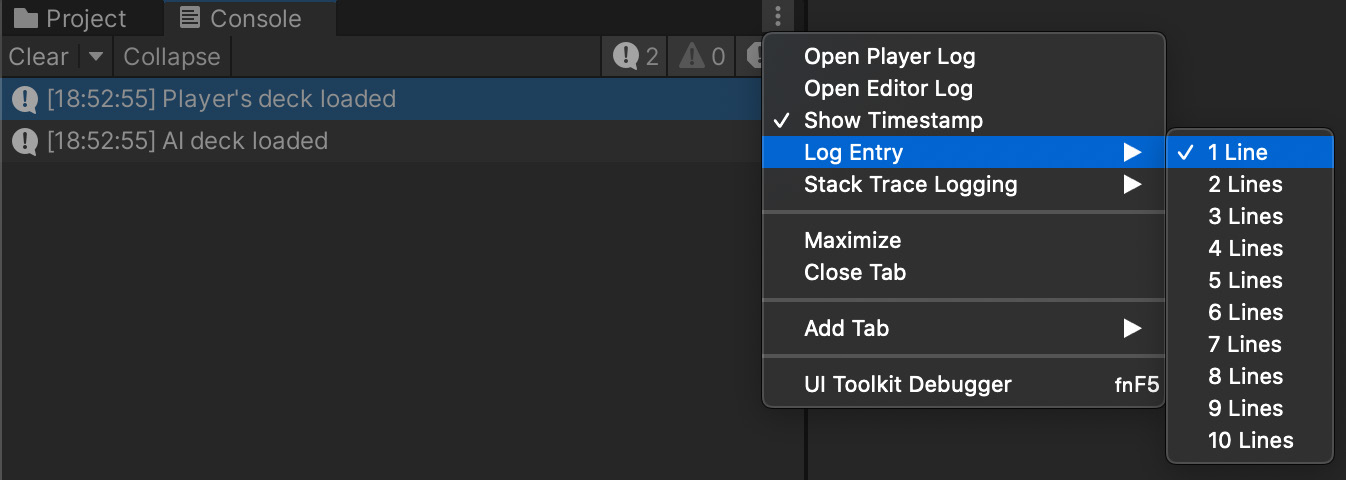
Настройте Console Log Entry для удобства чтения По умолчанию Console Log Entry отображает две строки. Чтобы сделать вывод удобнее, можно выбрать одну или несколько строк в соответствии со своими предпочтениями (см. изображение ниже).
Параметры Console Log Entry позволяют задать количество строк в сообщении журнала.
Дополнительные материалы - Отладка игрового кода с помощью Roslyn Analyzers - Запуск автоматизированных тестов для игр с помощью Unity Test Framework - Ускорение процесса отладки с помощью Microsoft Visual Studio Code - Отладка кода с помощью Microsoft Visual Studio 2022 - Советы по тестированию и обеспечению качества проектов Unity
©2025UnityTechnologies
IDEs and debugging
Pause execution with Debug.Break If you want to check certain values in the Inspector when the application is difficult to pause manually you can use Debug.Break to pause the execution in your code.
Save an if statement with Debug.Assert Debug.Assert checks a condition at runtime and logs an error message to the console if the condition you entered returns false. Unlike Debug.Log, which always runs, assertions are meant to flag unexpected states and can be more effective for validating assumptions in your code.
// You can save the if statement in release... if (health > maxhealth) {

    Debug.LogError(“Current health is greater than maxhealth!”, this);
}
//... by

using an assertion Debug.Assert(health < maxhealth, “Current health is greater than maxhealth!”, this);
Use Debug.Log with context When using Debug.Log, you can pass in an object (typically a GameObject or component) as a second parameter. This links the log message to that object in the Console, so when you click the message, Unity highlights the associated object in the Hierarchy. Debug.Log(“Enemy spawned”, gameObject);
Make important messages stand out with Rich Text Unity’s Console supports a subset of Rich Text (like <b>, <i>, <color>, etc.) in Debug.Log messages. You can use these to highlight, color-code, or emphasize parts of your log output, making important messages stand out during development. Debug.Log(“<b><color=red>Error:</color></b> Player health is critically low!”);Strip Debug Log from your builds Unity does not strip the Debug logging APIs from non-development builds automatically. Wrap your Debug Log calls in custom methods and decorate them with the [Conditional] attribute. Removing the corresponding Scripting Define Symbol from the Player Settings compiles out the Debug Logs all at once. This is identical to wrapping them in #if… #endif preprocessor blocks. See this General Optimizations guide for an example.
Troubleshoot Physics by visualizing your raycasting Troubleshooting physics? Debug.DrawLine and Debug.DrawRay can help you visualize raycasting by drawing a line between specified start and end points.
// draw a 5-unit white line from the origin for 2.5 seconds Debug.DrawLine(Vector3.zero, new Vector3(5, 0, 0), Color. white, 2.5f);

}Use Debug.isDebugBuild for development builds Use Debug.isDebugBuild to check if the application is running as a Development Build. This allows you to conditionally execute debug-only code, such as logging, diagnostics, or test utilities, without affecting release builds. if (Debug.isDebugBuild) {
Debug.Log(“Running in Development Build mode.”);
}Set Application.SetStackTraceLogType Use Application.SetStackTraceLogType or the equivalent checkboxes in PlayerSettings to decide which kinds of log messages should include stack traces. Stack traces can be useful, but they are slow and generate garbage.
Stack Trace in PlayerSettings in the Editor window
Customize your log The Logger API allows you to create and configure custom Logger instances for more advanced or modular logging. While you can use the built-in Debug.unityLogger, creating your own logger gives you finer control over log formatting, filtering, and output channels: var logger = new Logger(Debug.unityLogger.logHandler);
logger.Log(LogType.Log, “Custom log message”);
Speed up your workflows with Visual Code shortcuts If you use Visual Code as the IDE of choice, these shortcuts may prove useful: —
Windows
Mac
Configure your Console Log Entry for improved readability By default, the Console Log Entry shows two lines. For improved readability, you can configure this to be more streamlined with one or multiple lines depending on your preferences (see image below).
The Console Log Entry options allows you to set the number of lines in your log.
More resources —
How to debug game code with Roslyn Analyzers
How to run automated tests for your games with the Unity Test Framework
Speed up your debugging workflow with Microsoft Visual Studio Code
How to debug your code with Microsoft Visual Studio 2022
Testing and quality assurance tips for Unity projects